Why keep a trading journal
Without a journal, you remember the big wins and the painful losses, rarely the rest. A journal turns those impressions into numbers: which setups really pay, at what hours you lose, how much fees and off-plan trades cost you.
The principle is simple: one row per closed trade, filled in right after the exit, and a review every week. Excel or Google Sheets are more than enough for this.
The essential columns
| Column | Example | Why |
|---|---|---|
| Entry / exit date and time | 2026-10-14 09:32 | Analysis by session, hour, holding time |
| Instrument and market | BTCUSDT · crypto | Compare markets |
| Side | Long / Short | The P&L formula depends on it |
| Entry price, exit price, quantity | 60,010 · 60,590 · 0.5 | Gross P&L |
| Initial stop | 59,700 | Risk in R |
| Fees (commission, swap) | 60.30 | Net P&L |
| Setup | Breakout | Know what works |
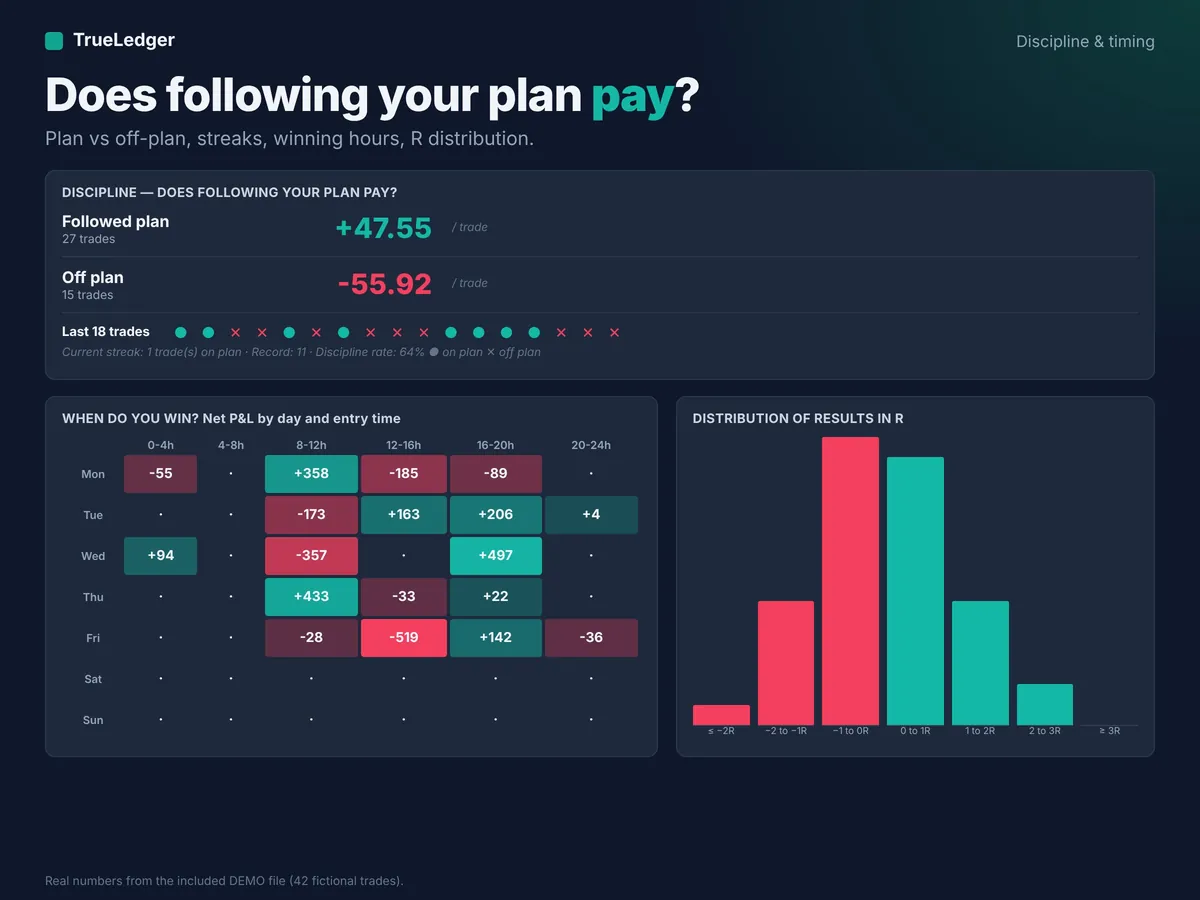
| In plan? Emotion | No · Revenge | Cost of indiscipline |
The "setup", "in plan" and "emotion" columns look secondary. Yet after 50 trades, they are the ones that show where the money goes.
Always think after fees
A trade that wins 300 on paper can bring only 230 once commissions and slippage are deducted. If your journal only calculates gross P&L, it overstates your strategy. The full method, with a worked example, is in our guide how to calculate net P&L after fees, and you can test a trade with the net P&L calculator.
The 5 metrics to track (with Excel formulas)
Example: 100 trades, 45 winners averaging +220 and 55 losers averaging −140 (net P&L in column P).
| Metric | Calculation | Example |
|---|---|---|
| Win rate | winners / total | 45% |
| Average win / average loss | 220 / 140 | 1.57 |
| Expectancy per trade | 0.45 × 220 − 0.55 × 140 | +22 |
| Profit factor | 9,900 / 7,700 | 1.29 |
| Max drawdown | largest drop from a peak | see below |
Win rate      : =COUNTIF(P2:P2001,">0")/COUNT(P2:P2001)
Expectancy    : =AVERAGE(P2:P2001)
Profit factor : =SUMIF(P2:P2001,">0")/-SUMIF(P2:P2001,"<0")
For max drawdown, add two columns: equity after each trade (Q) and the highest equity so far (R).
Q2 : =$B$1+P2          Q3 : =Q2+P3   (B1 = starting capital)
R2 : =Q2               R3 : =MAX(R2,Q3)
Drawdown : =Q3/R3-1    Max drawdown : =MIN(S3:S2001)
The weekly review, in 15 minutes
- Net result for the week and max drawdown.
- Best and worst setup.
- Off-plan trades: how many, and what they cost.
- Share of gross profit absorbed by fees.
- One single rule to fix next week.
Excel, Google Sheets or an app?
Online journal apps often charge a monthly subscription and ask for access to your account. A spreadsheet costs nothing to run, works with any broker and keeps your data with you. Its limit: you log or import trades, it doesn't fetch them in real time.
If you start from scratch, begin with the columns above. If you want to save time, a ready-made template already does all these calculations.

The ready-made template
TrueLedger does all of these calculations for you in Excel or Google Sheets: net P&L after fees and slippage, expectancy, profit factor, max drawdown, discipline and challenge tracking. DEMO file included.
View the journal on Etsy →