Trading P&L & Break-Even Calculator After Fees
Enter a trade (stocks, forex, futures or crypto): the calculator deducts commissions, spread, slippage and funding, then gives the exit price at which the trade neither wins nor loses.
How the calculator works
It starts from the gross result of the move you target, then deducts every cost of the round trip: commission on each order (per share, per lot, per contract, % of notional or flat, with an optional minimum), spread if your prices don't already include it, slippage on entry and exit, and funding or swap. The break-even price is the target exit at which the net result is exactly zero with those same costs.
Worked example (hypothetical): 300 shares
Long 300 shares at $52.40, target $53.00, commission $0.005 per share per order with a $1 minimum, slippage allowance $0.02 per share on each side.
| Step | Calculation | Amount |
|---|---|---|
| Target gross P&L | (53.00 − 52.40) × 300 | $180.00 |
| Commissions | 2 orders × max($1, 300 × $0.005) | −$3.00 |
| Slippage | (0.02 + 0.02) × 300 | −$12.00 |
| Net P&L | 180 − 3 − 12 | $165.00 |
| Break-even price | 52.40 + 15 / 300 | $52.45 |
Costs take 8.3% of the target gain here. With a 10-cent target ($30 gross), the same $15 of costs would take half of it: the smaller the move, the more fees matter.
What it does not include
- Taxes, borrow fees for short selling and margin interest, unless you enter them under "Other fees".
- Spread, slippage and funding, unless you enter them.
- Live prices: you enter your own prices, nothing is fetched.
All formulas, conventions and rounding rules are on the methodology page.
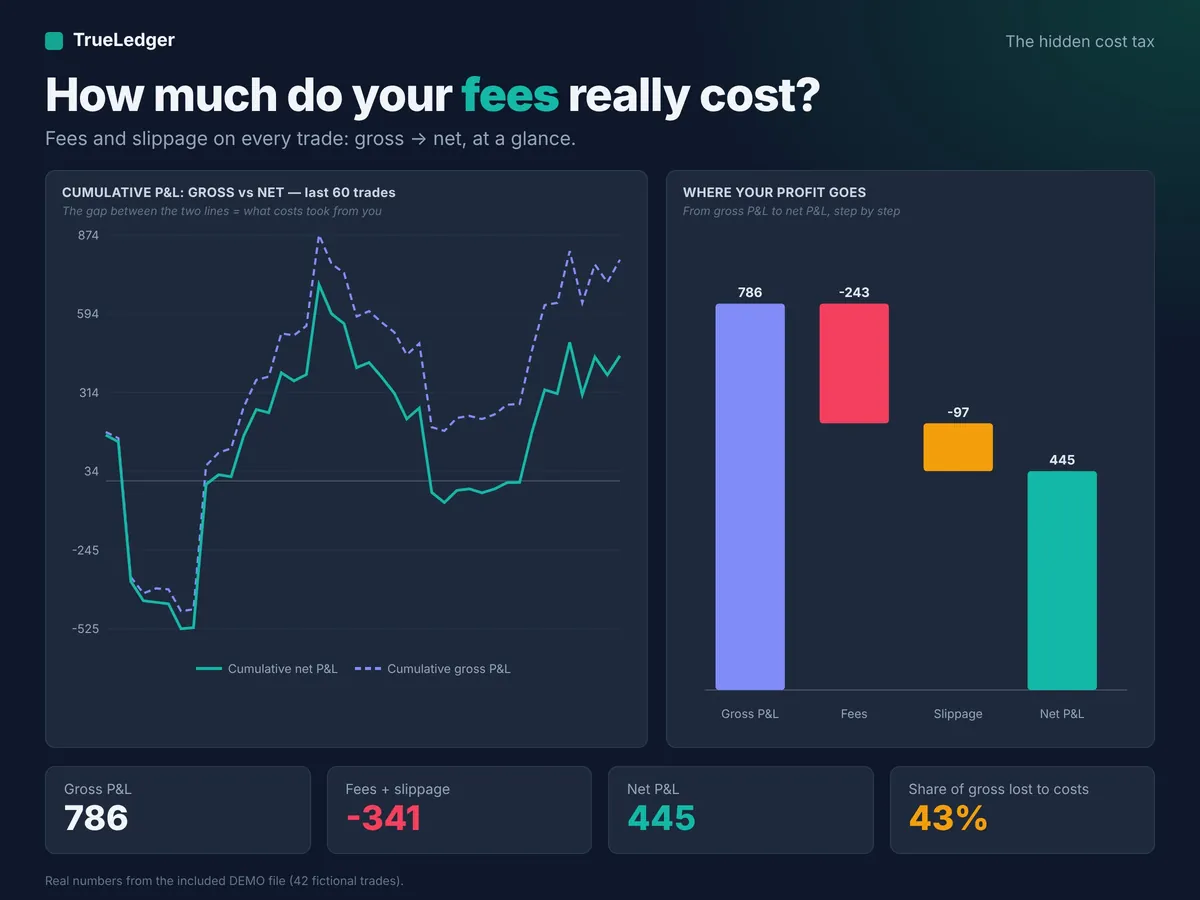
Apply this calculation to your whole history
This calculation covers one trade. TrueLedger applies it to every trade in Excel or Google Sheets and shows which markets, hours, setups and behaviours really cost you money.
View the journal on Etsy →