Gross P&L vs net P&L
Gross P&L compares the entry and exit prices you aimed for. Net P&L is what actually lands in your account, after deducting:
- commissions (on entry and exit);
- slippage: the gap between the price you wanted and the price you got;
- spread, when it isn't already in the executed prices;
- swap or financing for positions held overnight (it can also be a credit).
Worked example: a crypto trade
Buy 0.5 BTC, target entry 60,000, target exit 60,600, 0.1% commission on each side. Actual fills: 60,010 on entry, 60,590 on exit.
| Step | Calculation | Amount |
|---|---|---|
| Target gross P&L | (60,600 − 60,000) × 0.5 | 300.00 |
| Slippage | (10 + 10) × 0.5 | −10.00 |
| Entry commission | 60,010 × 0.5 × 0.1% | −30.01 |
| Exit commission | 60,590 × 0.5 × 0.1% | −30.30 |
| Net P&L | 300 − 10 − 60.30 | 229.70 |
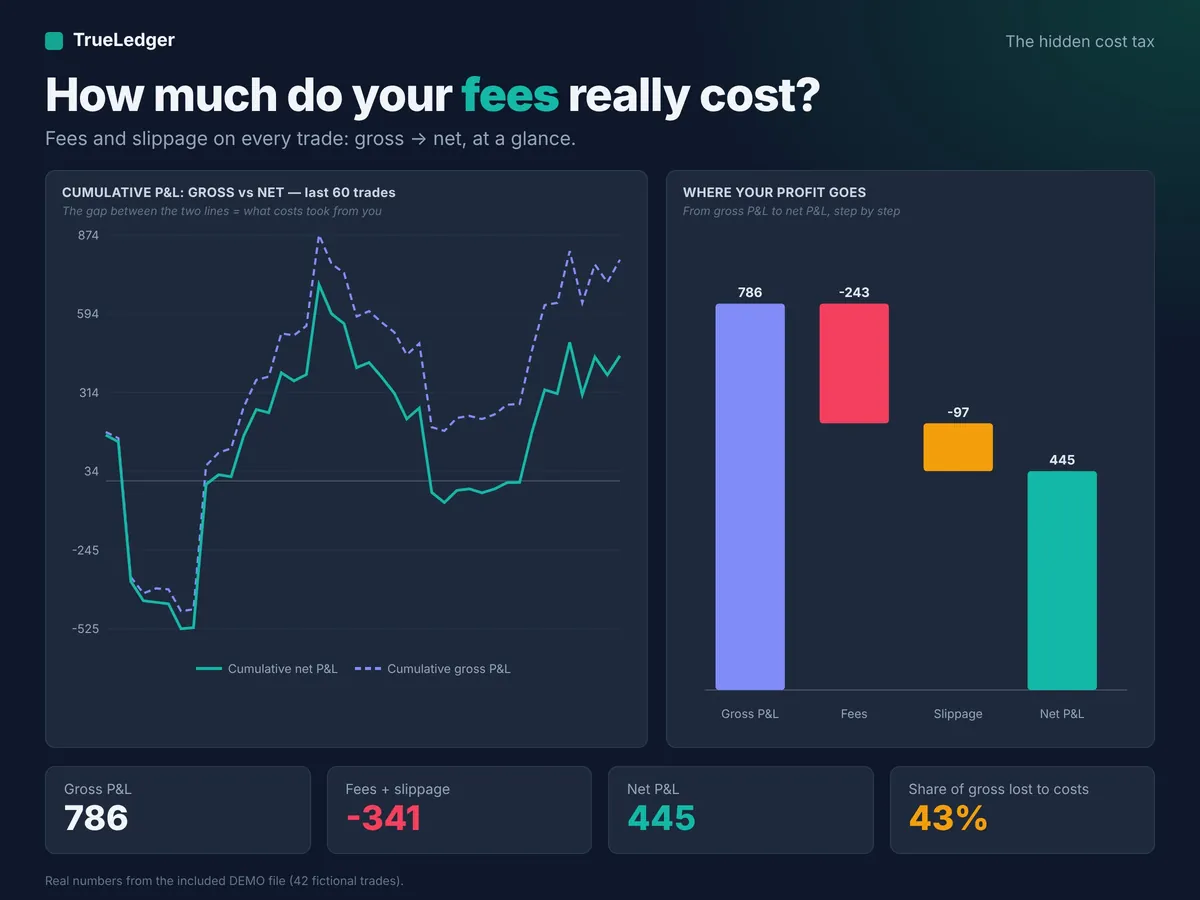
Costs here are 23.4% of the target gain (70.30 / 300). We call this share the "hidden cost tax": it shows up nowhere if you only log gross results.
The same trade in R
With a stop at 59,700, initial risk was (60,000 − 59,700) × 0.5 = 150. The trade is worth 2R gross (300 / 150), but only 1.53R net (229.70 / 150). For a strategy aiming at 2R per trade, that gap completely changes the expectancy.
What about forex?
On 1 lot of EURUSD (100,000 units), 1 pip is worth 10 USD. A 10-pip target brings 100 USD gross. With a 7 USD round-turn commission and half a pip of slippage on entry and exit (1 pip, i.e. 10 USD), 83 USD net remain: 17% of the gain goes to costs. The smaller your target, the higher that share.
The formula in Excel or Google Sheets
With side in B (Long / Short), entry in C, exit in D, quantity in E, commissions in F and swap in G (a cost is positive, a credit negative):
=(D2-C2)*E2*IF(B2="Long",1,-1)-F2-G2
Use the actually executed prices: slippage is then already included. To track the hidden cost tax, divide total costs by total gross P&L.
Reduce what fees cost you
- Aim for moves clearly larger than your round-turn costs.
- Compare maker and taker fees: a limit order is often cheaper.
- Measure your real slippage by market and by hour: it is often higher at the open and around news.
- Trade less often if the hidden cost tax takes a large share of your gross profit.
The ready-made template
TrueLedger does all of these calculations for you in Excel or Google Sheets: net P&L after fees and slippage, expectancy, profit factor, max drawdown, discipline and challenge tracking. DEMO file included.
View the journal on Etsy →